Case 01 · Ads Console
August → September 2023PPC performance






Explore performance snapshots and before-and-after transformations in separate galleries.
Three original-and-updated examples. Select an image to inspect the details at full size.
Smart Providerr in numbers
Our success is directly tied to the growth and expansion of our amazing clients.
Share your experience
Your feedback helps us grow.
Exclusive To Smart Providerr
Other agencies run your brand through scattered third-party tools. You get your own portal and companion app — log in anytime and watch your sales, campaigns, creatives, and tasks update live.
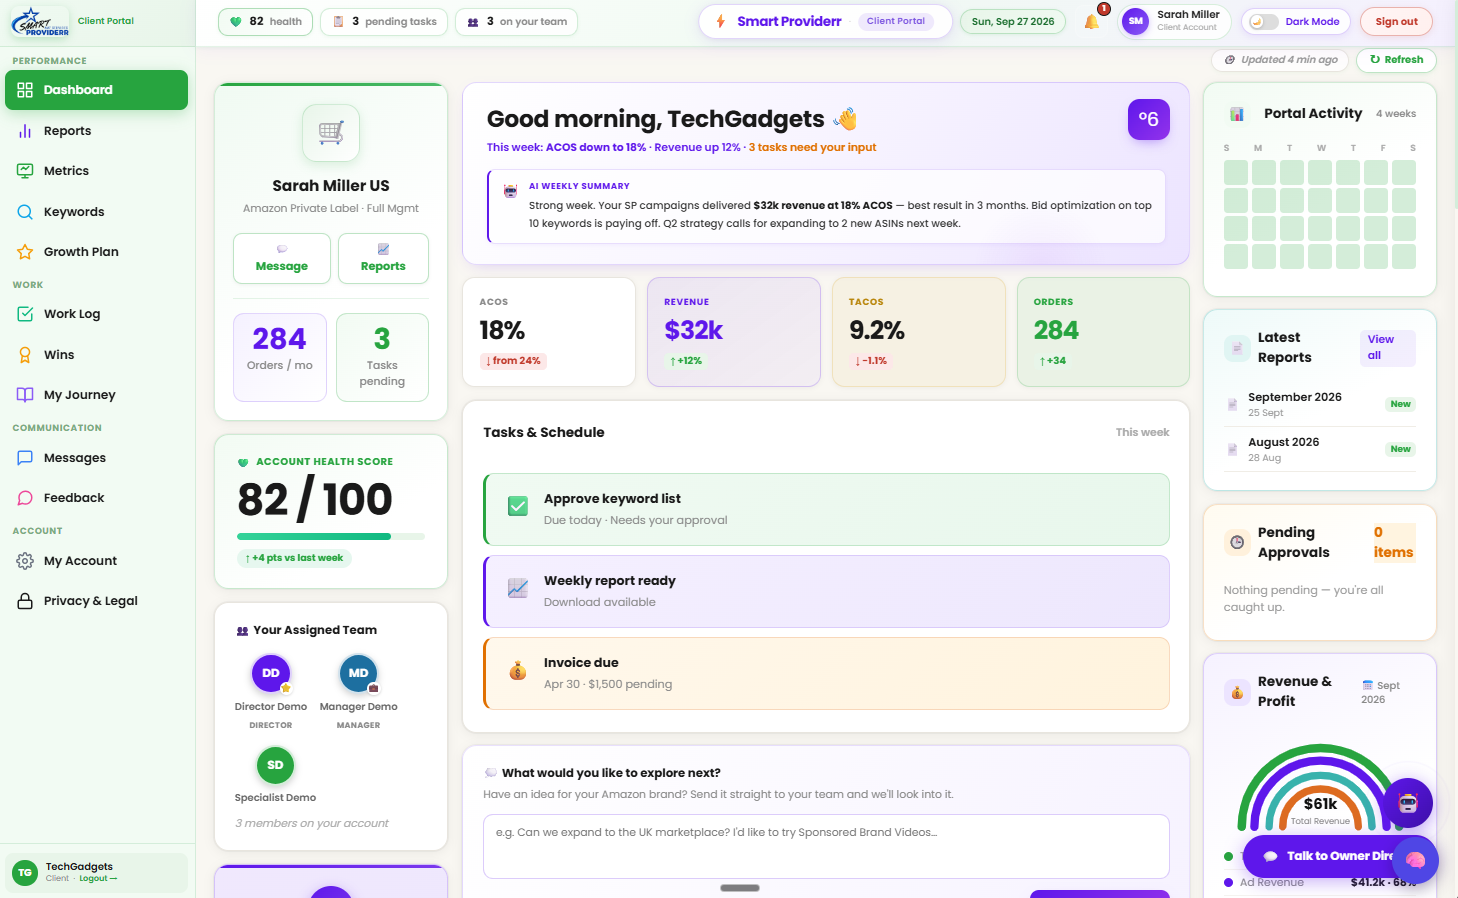
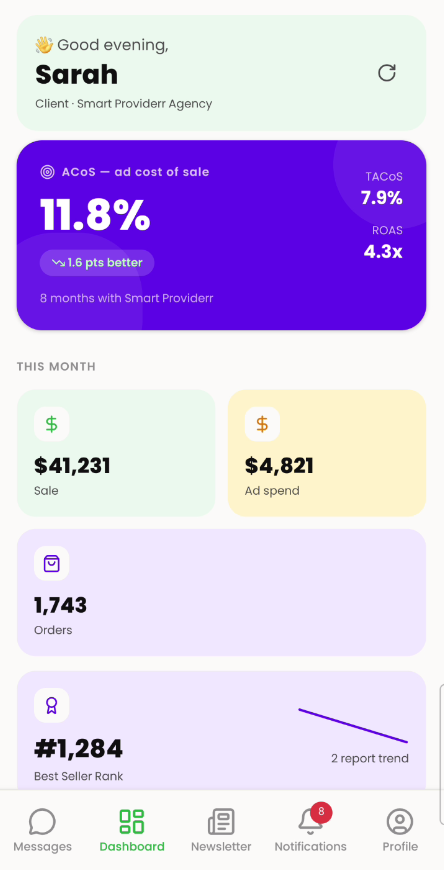
For clients and teammates: keep your Smart Providerr companion app close, whether you are reviewing the next move or checking in from the road.
If any of these feel familiar, your account is leaking revenue every single day.
You are optimizing the wrong metric. ACOS alone hides how much margin you are actually losing.
Paid and organic working in silos means zero momentum where it counts — the Flywheel never spins.
No margin context, no category depth — just recycled playbooks from other niches.
Dashboards full of numbers, and no one telling you what to actually do next week.
Budget goes up, returns keep shrinking — and nobody can explain why.
They are winning your keywords and taking your rank while your listings sit still.
Most agencies running Amazon advertising chase clicks. We chase profit. By building your campaign structure around real bottom-line data, we turn your ad spend into a growth asset — not another monthly expense.
Start with clarity. Book a free 1-on-1 call with our strategy team — we review your brand, listings, and goals, and show you exactly where your biggest growth opportunities lie.
We run a deep audit of your Amazon presence — visuals, content, traffic, and conversions — and hand you a clear, data-driven roadmap of what needs fixing first and how we will move the needle.
Once you are ready to move, you get a dedicated success manager. Approve the plan, align timelines, and we set up creative delivery and PPC execution from day one.
Results start fast. We deliver your first creative and campaign batch, gather your feedback, and keep optimizing until CTR, CVR, and ROI keep climbing — designed to perform, not just look good.
This is what our clients have to say about us.
Client results & feedback
The video above shares a client’s voice. These cards highlight the account screenshots and before-and-after examples behind our case studies. Explore any card to see the source image and context.
Explore all case studiesHere are answers to the most common questions. Can't find an answer? Call us!
Both — and everything in between. We handle full Amazon growth: creative, PPC management, catalog, storefront, and A+ content. One team, one strategy, no silos.
Both, deliberately. AI speeds up research and first drafts, but every listing, image, and campaign is reviewed and finished by senior specialists before anything goes live.
We start from search-term data, competitor gaps, and your real margin numbers — then write and design around what converts, not what merely looks nice.
Most clients see their first creative or campaign batch within 2–3 weeks of onboarding. Full account transformation typically compounds over 60–90 days.
That is exactly who we built this for. We start with a deep audit that shows you what went wrong before — and how our process is different.
Absolutely. Many clients start with a single hero product to see how we work, then expand once the numbers prove it.
We could — but pricing without context is guessing. The free strategy call exists so we can scope the right plan for your catalog size and goals.
Every brand is different. Packages are scoped after the audit, based on the work your account actually needs — and you always approve the plan before anything starts.
No long lock-ins. We work month to month and let the results do the retention.
Every brand is different, but clients typically see healthier ACOS, stronger organic rank, and better conversion within the first 60–90 days. We set clear KPIs together in the gameplan so success is measurable.
No pressure. The strategy call and audit are completely free — use them to understand your account. Start whenever the roadmap makes sense for you.
Always. Your client portal shows live sales, spend, ACOS, and every task we’re working on — plus weekly reports. You will never have to chase us for numbers.
Explore Amazon Ads and Seller Central results from eight distinct accounts, including two PPC comparisons and real listing examples.
Each story states exactly what its screenshots show. Listing examples come from different products in one account; period results are not presented as proven causes or profit.
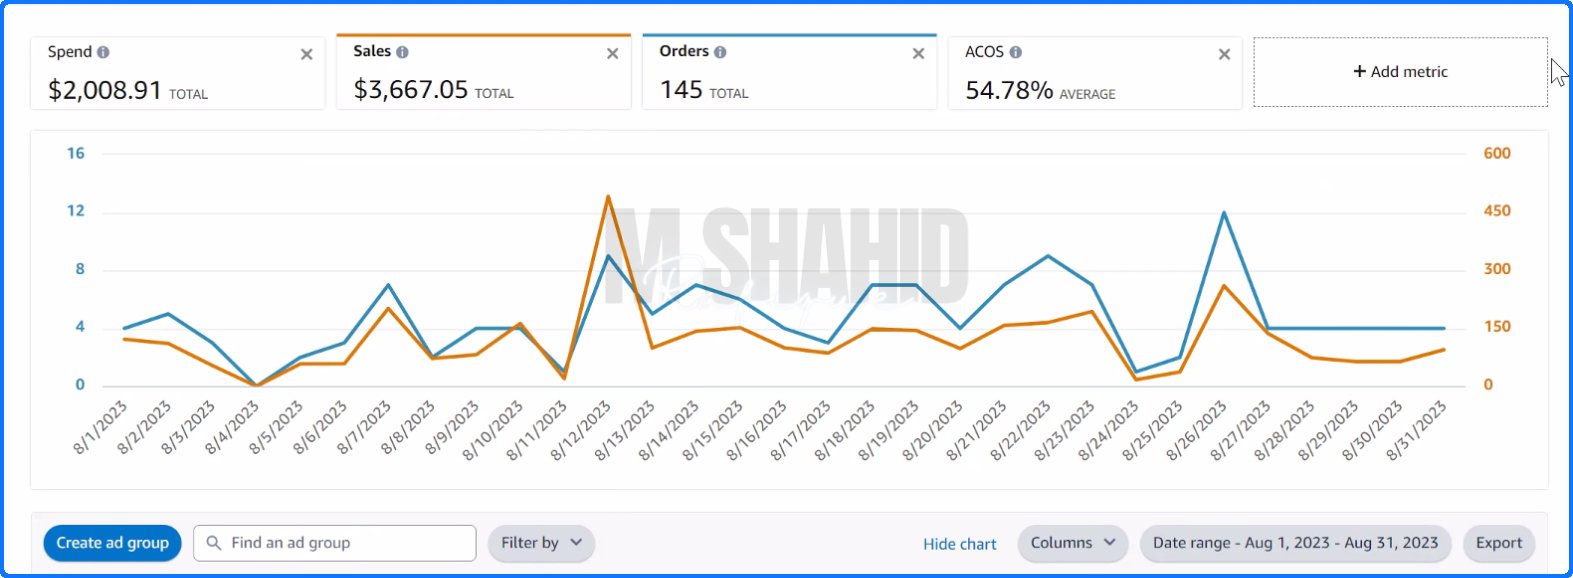
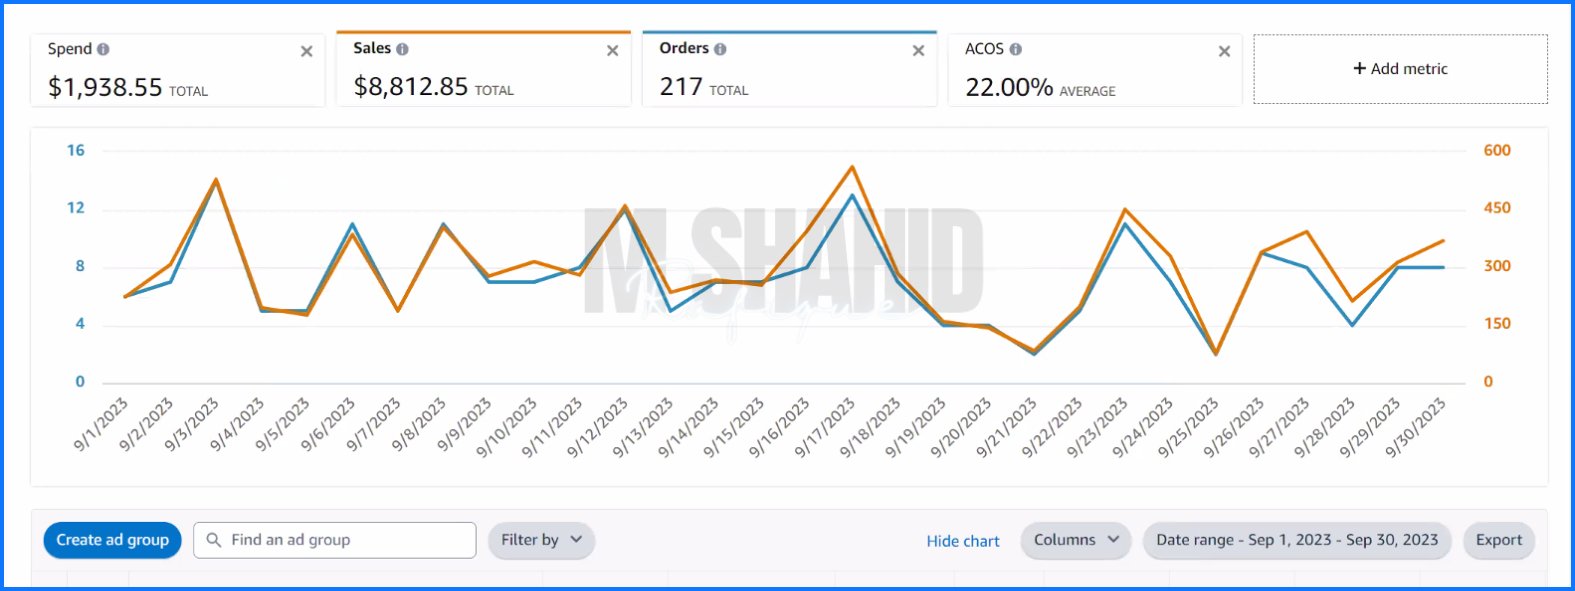
Before & afterTwo monthly Ads Console views show ad-attributed sales rising from $3,667.05 to $8,812.85 while ACOS moved from 54.78% to 22.00%.
 Before & after
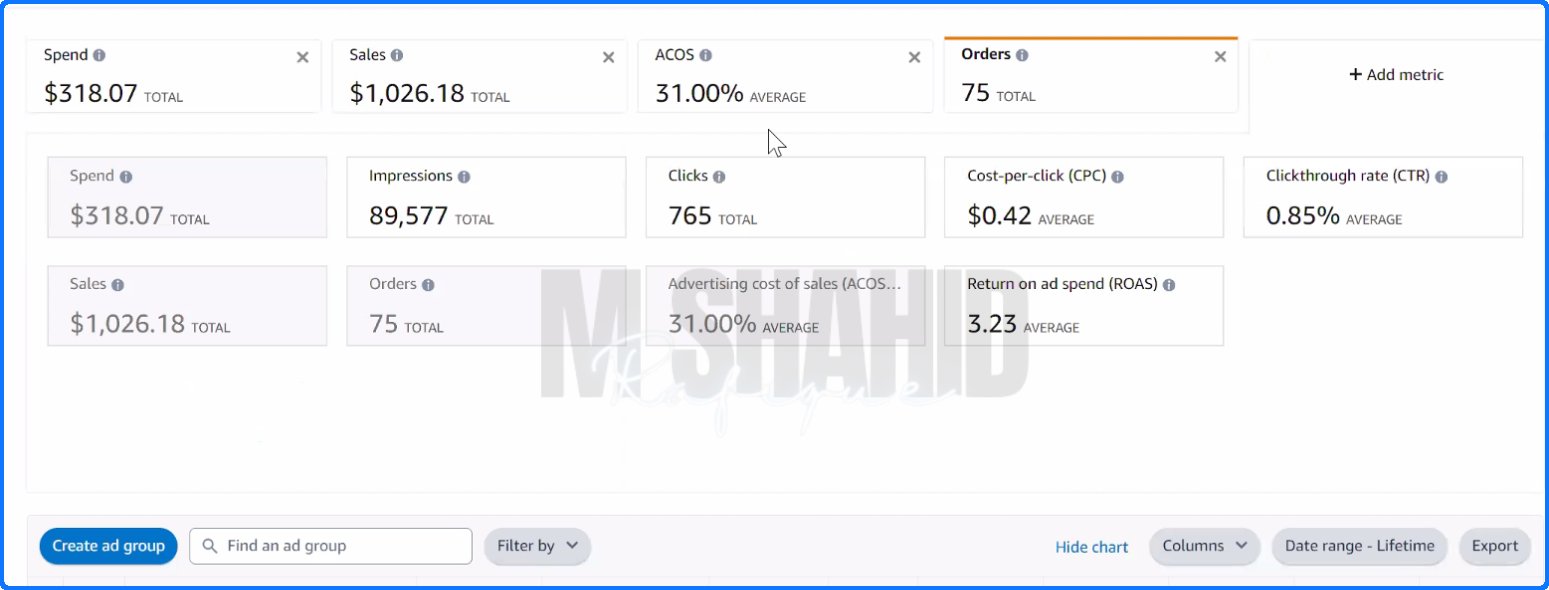
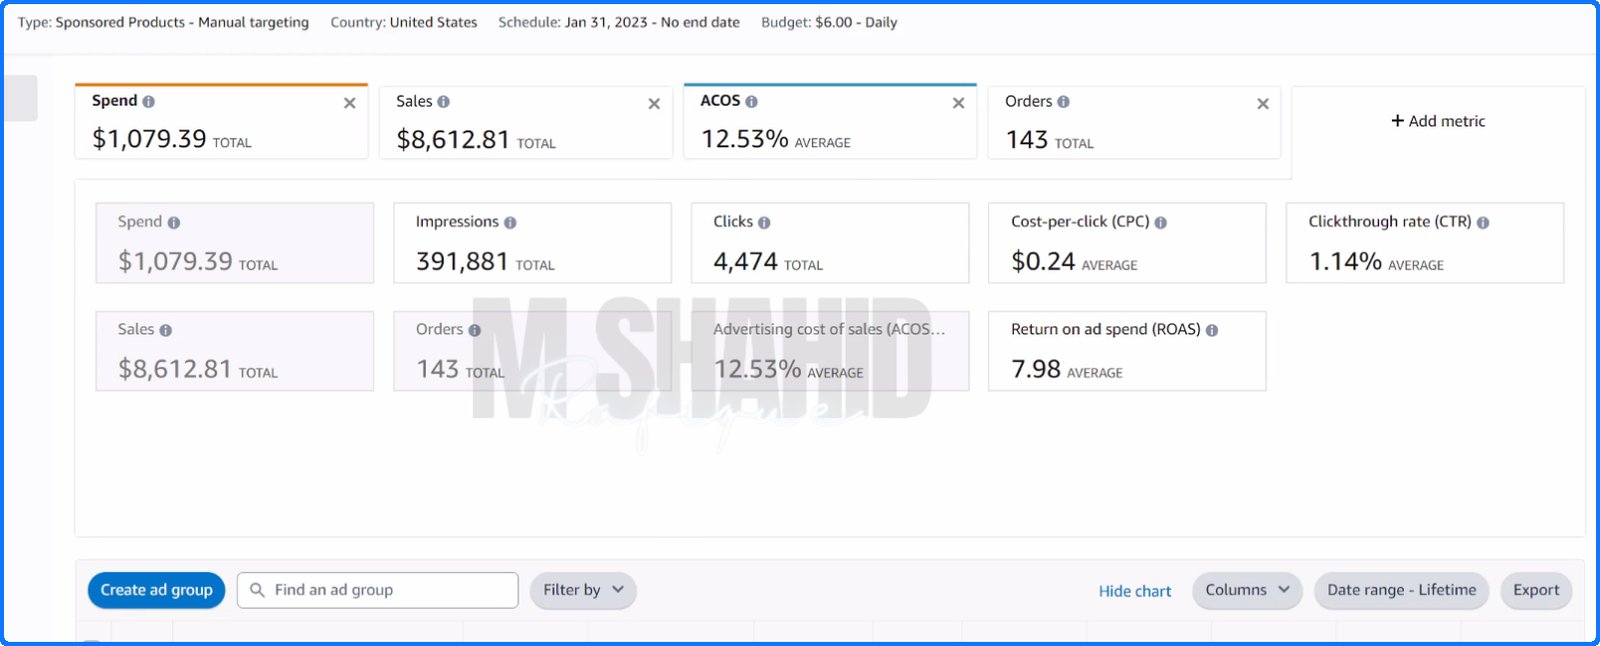
In another account, the later campaign view shows lower ACOS and CPC, a higher click-through rate, and $8,612.81 in cumulative attributed sales.
 Listing examples
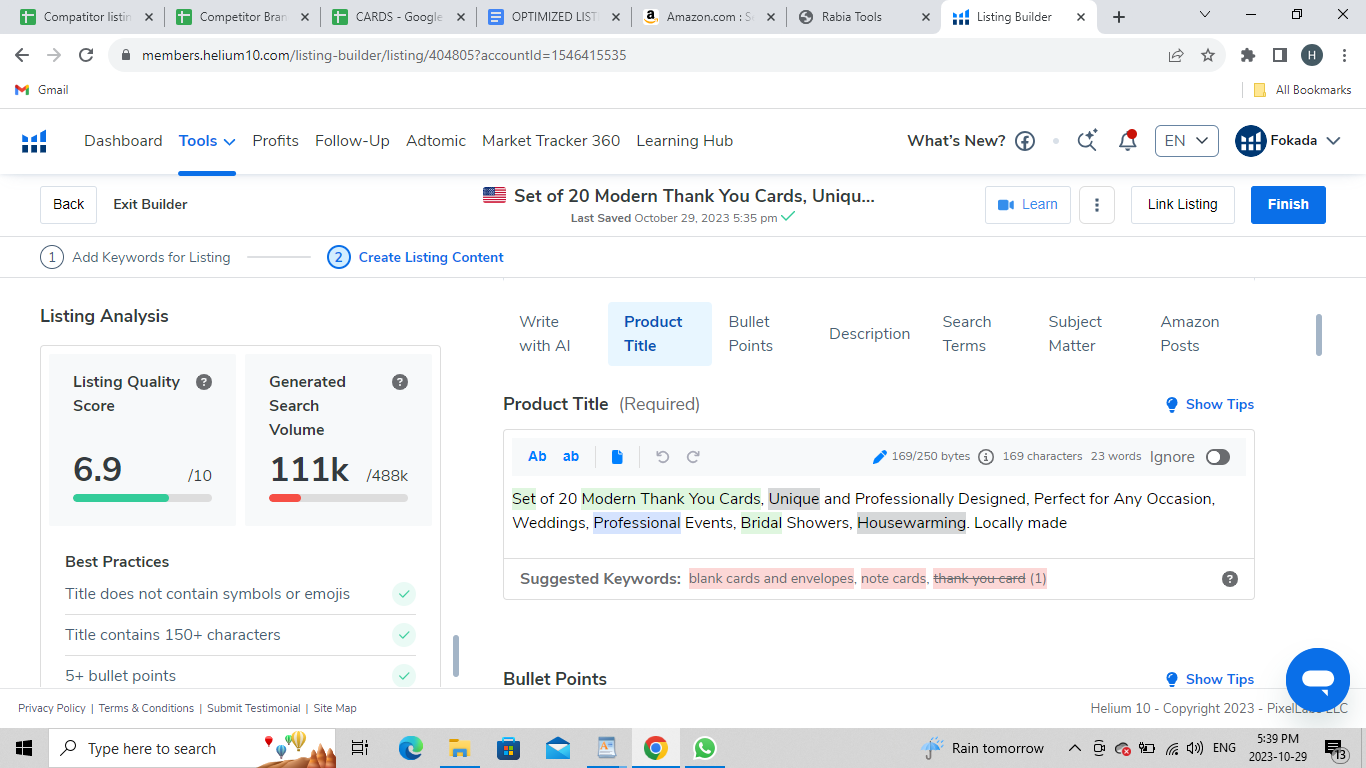
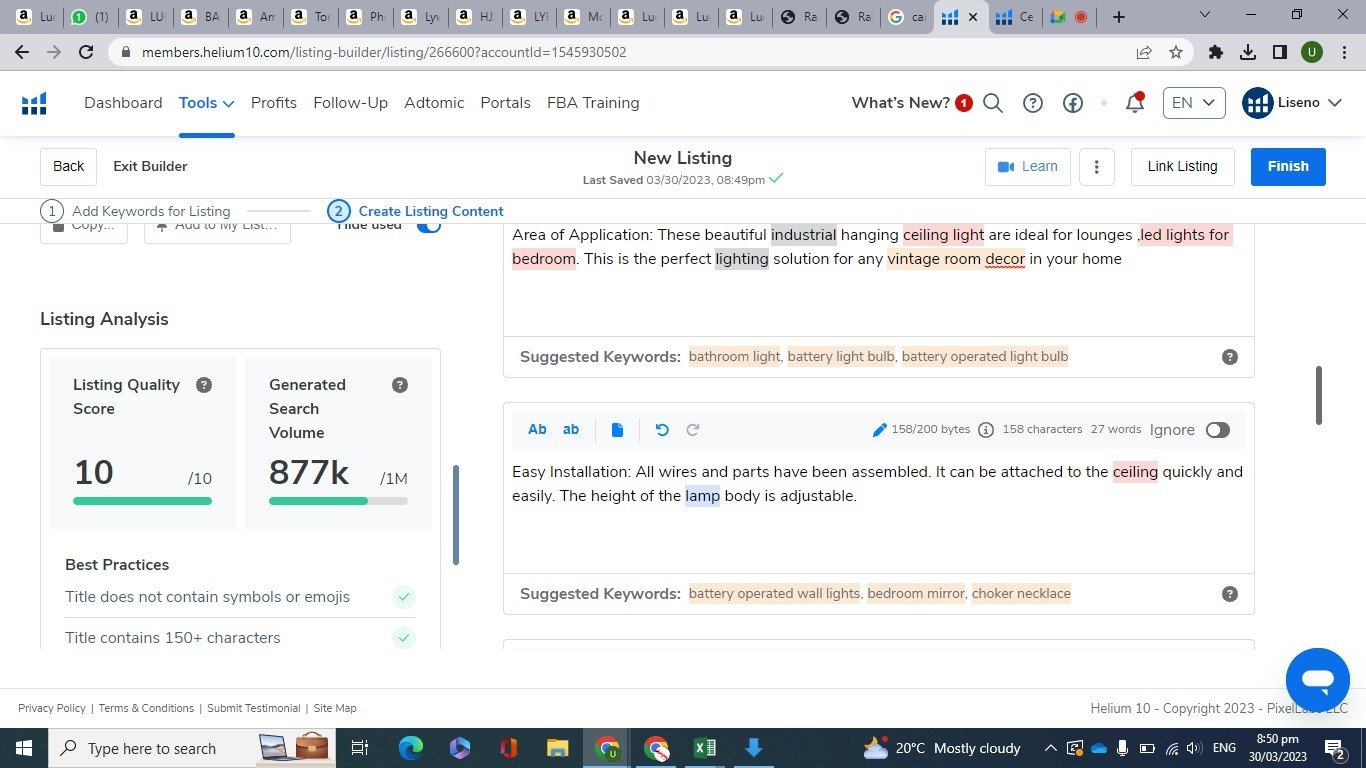
One account’s Helium 10 screenshots show a 6.9/10 quality score for a thank-you card listing and 10/10 for a ceiling-light listing. They are different products.
 Results achieved
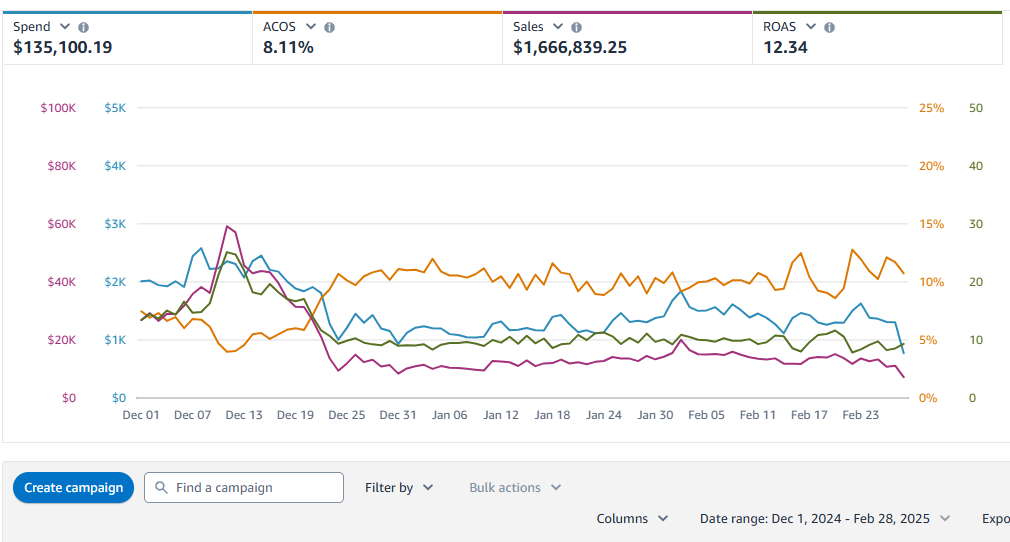
A separate Ads Console account recorded $1,666,839.25 in attributed sales on $135,100.19 of spend over a three-month window.
 Results achieved
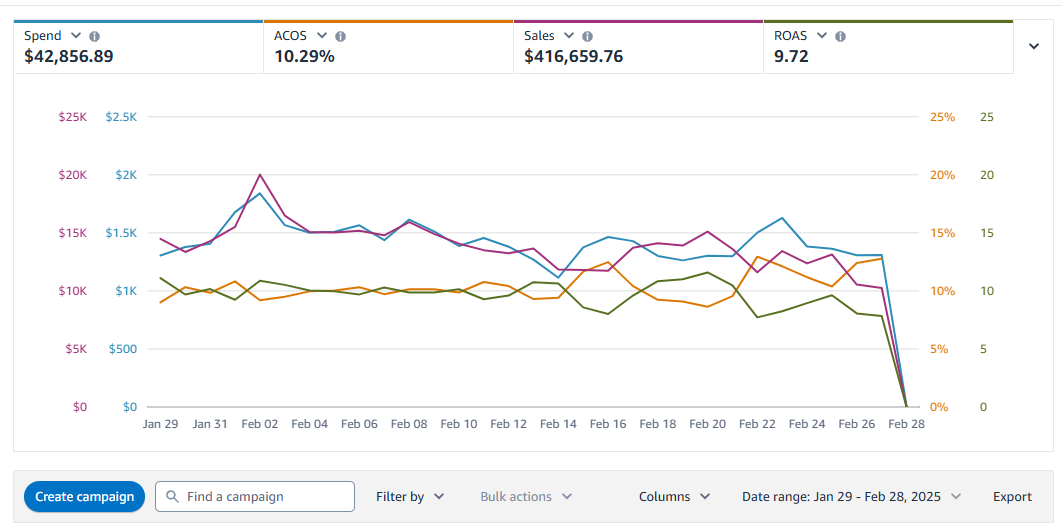
A different Ads Console account shows $416,659.76 in attributed sales, 10.29% ACOS and 9.72 ROAS in its selected 30-day view.
 Results achieved
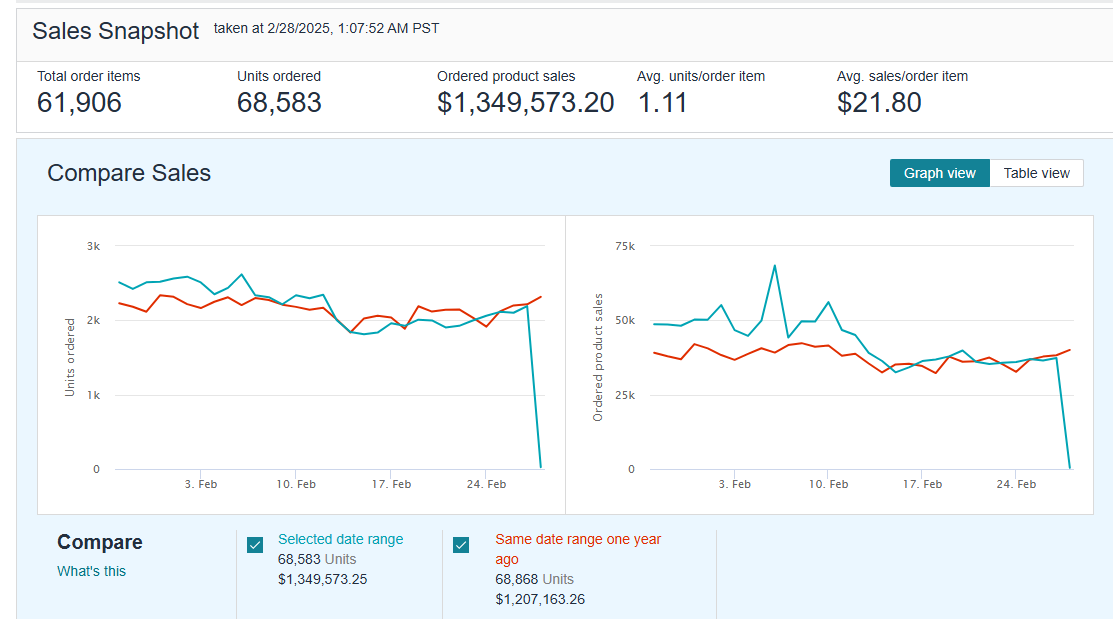
A separate Seller Central account shows $1,349,573.20 in ordered product sales and 11.8% more sales value than the same range a year earlier.
 Results achieved
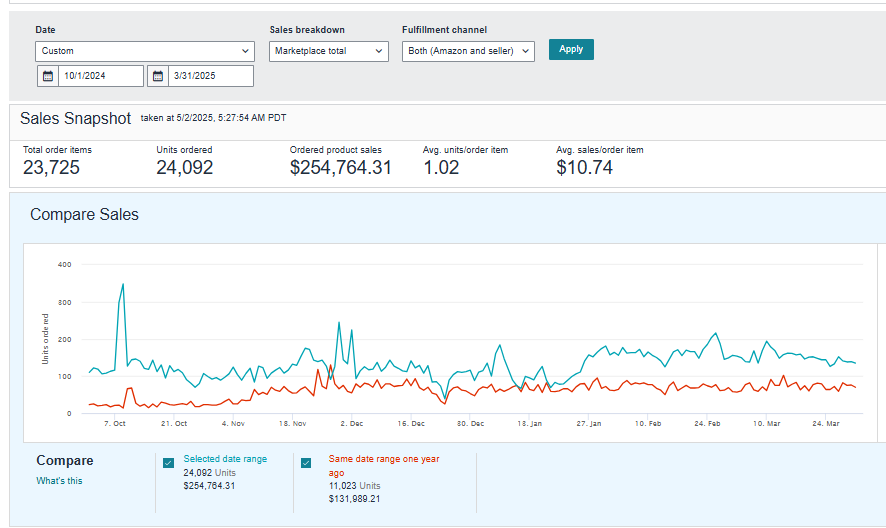
Another Seller Central account shows $254,764.31 in ordered product sales for the selected October-to-March range, compared with $131,989.21 a year earlier.
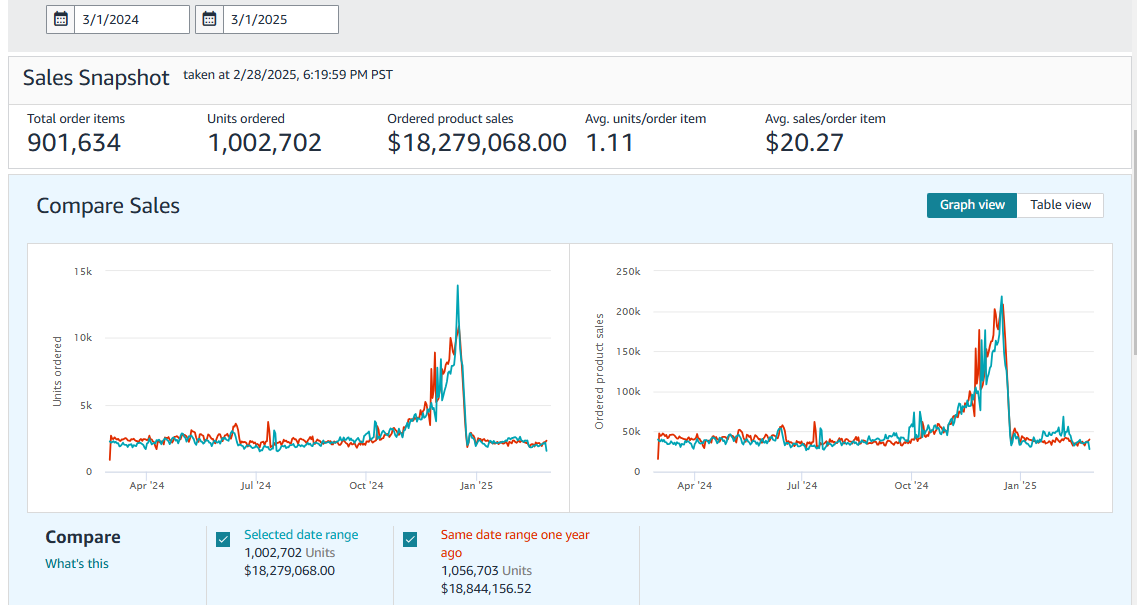
Results achievedA fifth results account shows $18,279,068 in ordered product sales and more than one million units, while the same-period comparison is 3.0% below the year before.
 28 Sep 2026
Search Query Performance reports show exactly what Amazon shoppers type before they buy. Here is how to read them and turn the data into ranked keywords and sales.
Read More 21 Sep 2026
Thinking about hiring an Amazon PPC agency? Here is what a specialist partner actually does day to day — campaign architecture, keyword research, bid management, and the reporting you should expect.
Read More 14 Sep 2026
Lower ACOS by cutting wasted spend — not by cutting the campaigns that drive your rank. Seven levers we use on client accounts, in the order we pull them.
Read More