
The tension in August
The August account snapshot shows $2,008.91 of spend for $3,667.05 of ad-attributed sales. At 54.78% ACOS, more than half the attributed sales value was being spent on ads. The 145-order figure helps ground the story beyond revenue alone.
A very different September
A month later, the visible spend was slightly lower at $1,938.55, while ad-attributed sales reached $8,812.85 and orders reached 217. Sales were 140.3% higher, spend 3.5% lower, and ACOS 32.78 percentage points lower. These are adjacent monthly outcomes—not proof of which campaign change caused them.
The source screenshots
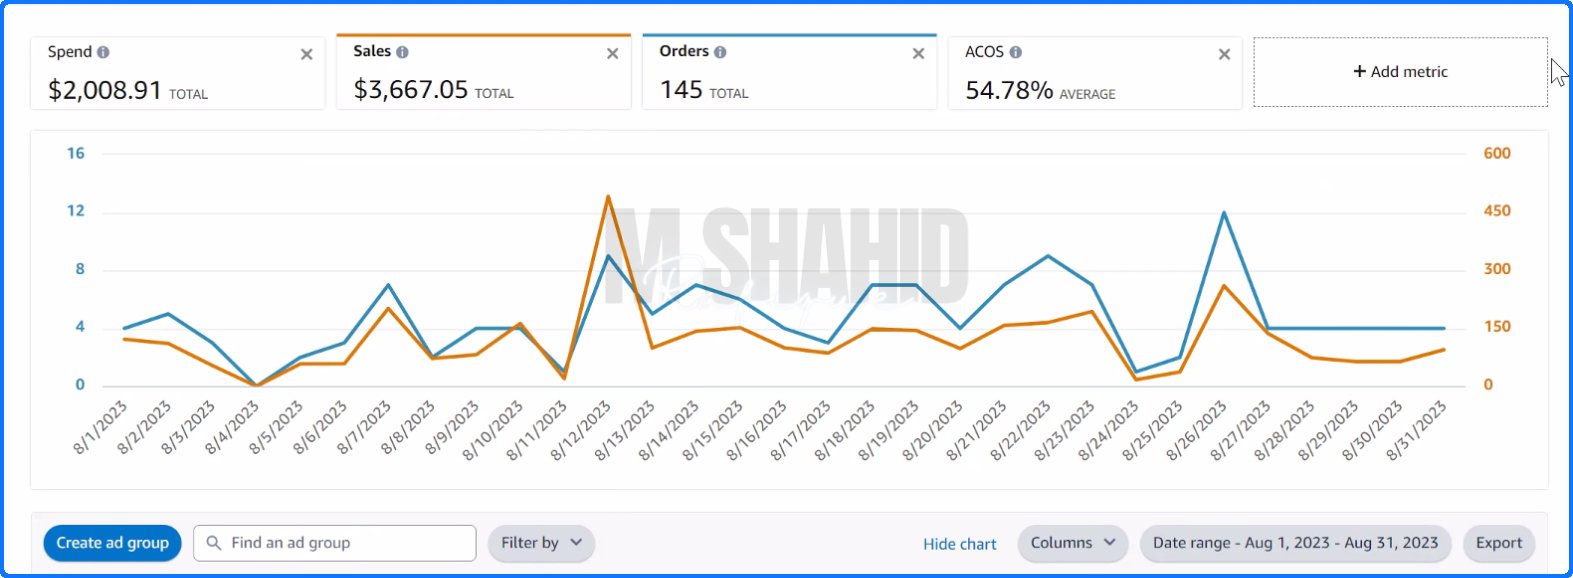
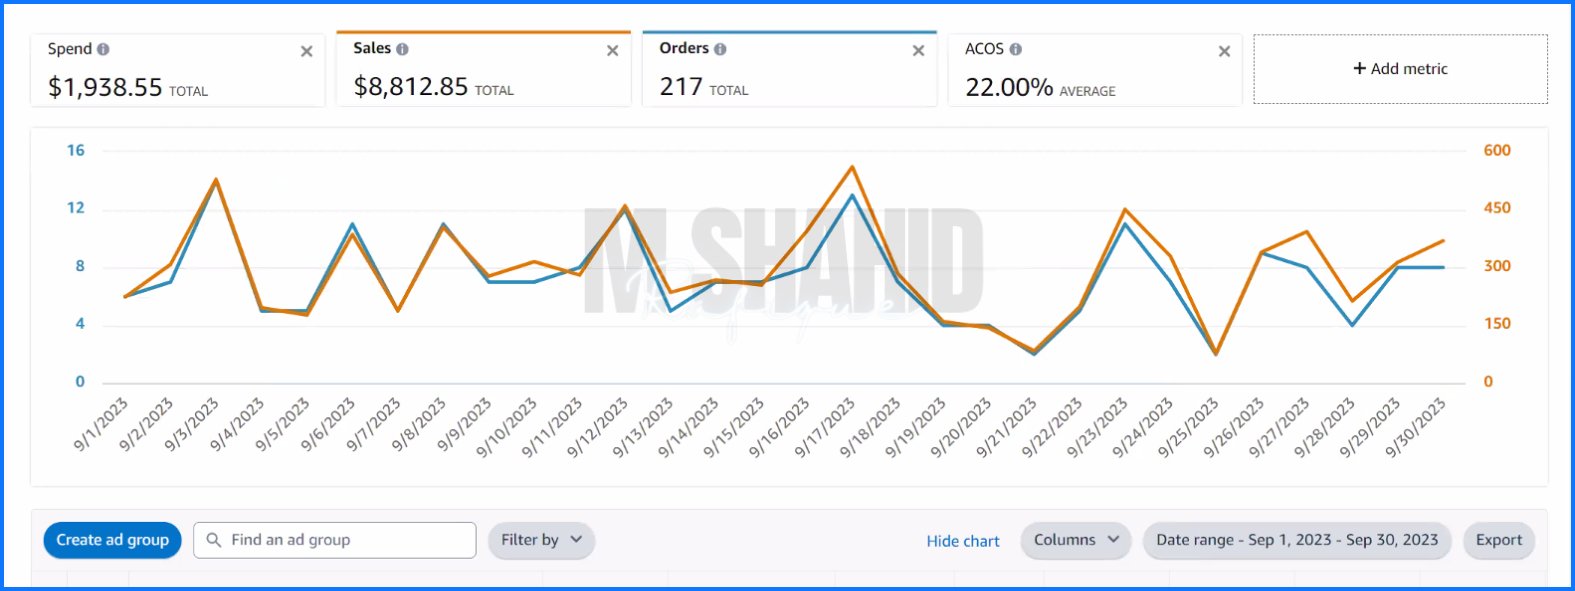
What a deeper audit would check
Amazon defines ACOS as spend divided by attributed sales. To understand the mechanism behind this shift, the next layer would be search-term, targeting, placement and advertised-product reports, checked against margin, stock and Featured Offer eligibility. Those details are not visible in the two images.
Reading this result responsibly
The two images compare one account across two calendar months. The specific actions and causal drivers were not supplied.
Amazon’s official documentation gives context for the metrics and platform rules. It does not establish the cause of this account’s result.