
Scale deserves an honest comparison
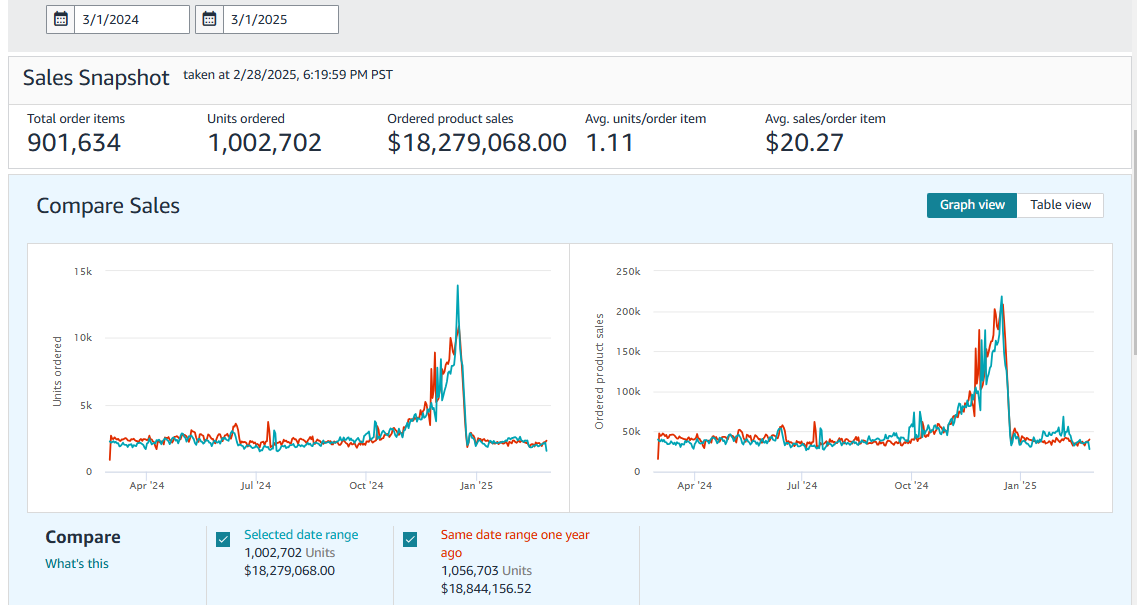
The Sales Snapshot reports $18,279,068 in ordered product sales and 1,002,702 units. Those are substantial totals. The comparable earlier range, however, shows $18,844,156.52 and 1,056,703 units: sales value was 3.0% lower and unit count 5.1% lower.
Why the difficult number belongs
A story that mentioned only “$18 million in sales” would conceal the direction of travel. The chart shows a pronounced seasonal peak, but not why the full-period total softened. It invites a closer look at category demand, inventory, price, offer quality and product mix rather than an unearned claim of growth.
The source screenshots
The practical review
Amazon Business Reports allow date-range and ASIN-level comparisons. At this scale, even a small percentage gap has material value. This screenshot demonstrates both the account’s scale and its year-over-year headwind; it does not reveal a cause or a remedy.
Reading this result responsibly
The screenshot contains no product-level reports or verified intervention. We do not claim that Smart Providerr caused the displayed total.
Amazon’s official documentation gives context for the metrics and platform rules. It does not establish the cause of this account’s result.