
A like-for-like range
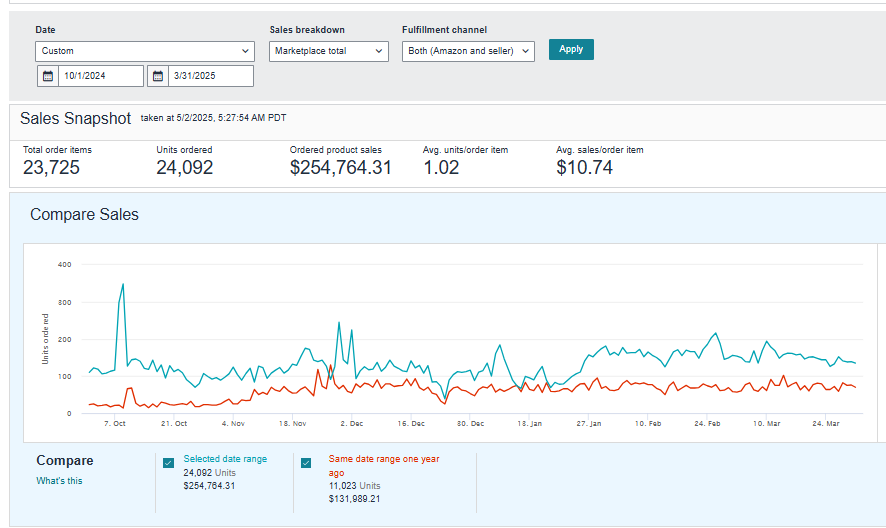
For October 1, 2024 through March 31, 2025, the snapshot shows $254,764.31 in ordered product sales and 24,092 units. The comparison row shows $131,989.21 and 11,023 units for the corresponding earlier range. That is 93.0% higher sales value and 118.6% more units.
The chart makes it tangible
The current-period line sits above the year-earlier line through much of the view, with spikes and dips a single headline percentage would hide. The screenshot does not reveal whether assortment, stock, traffic, conversion or ads created the difference.
The source screenshots
What would complete the story
Amazon Business Reports can break sales and traffic down by date and ASIN. That is where the account team can test which products carried the gain. The published case stays anchored to the screenshot rather than an invented campaign backstory.
Reading this result responsibly
The supplied screenshot supports the like-for-like calendar comparison but includes no product-level or intervention data.
Amazon’s official documentation gives context for the metrics and platform rules. It does not establish the cause of this account’s result.