Real Amazon work, told with evidence.
Eight account stories from Ads Console, Seller Central and listing workflows. Read the numbers, see the underlying images, and understand what each result does and does not prove.
Go beyond the headline metric.
Choose a category, then open the original screenshots and the full story behind each view.
The five Results Achieved screenshots are from five separate accounts. The two PPC comparisons each belong to one account. The listing examples are from one account but show different products, so they are not a measured same-product transformation.
 Before & after
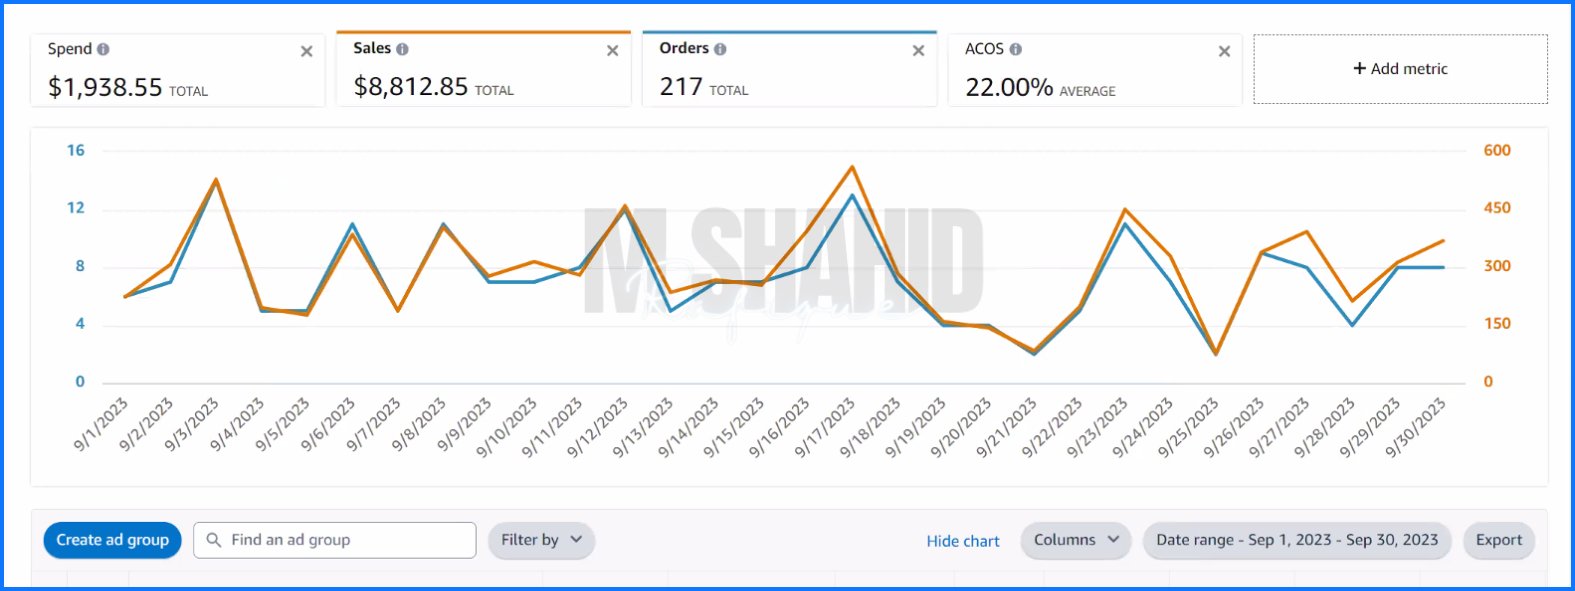
More ad sales on slightly less spend
Two monthly Ads Console views show ad-attributed sales rising from $3,667.05 to $8,812.85 while ACOS moved from 54.78% to 22.00%.
 Before & after
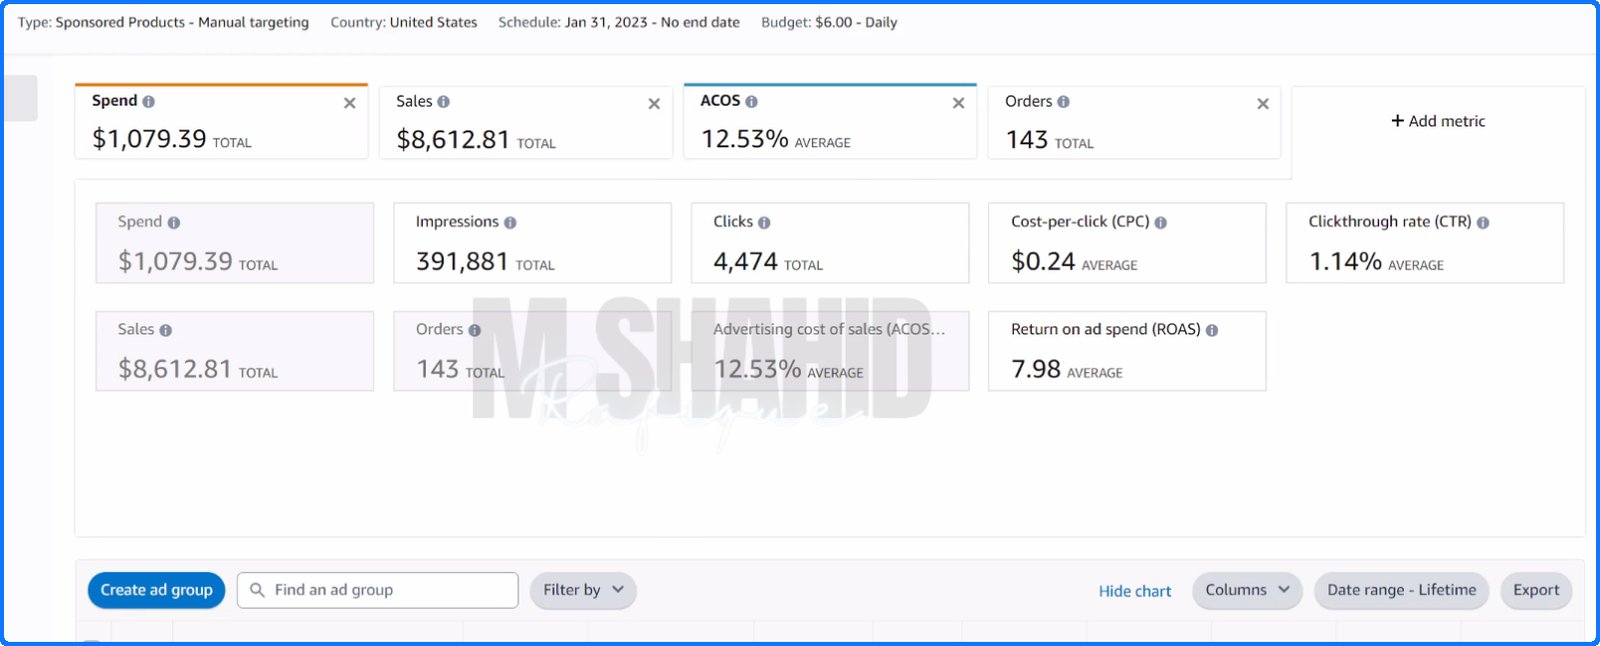
A Sponsored Products campaign at 12.53% ACOS
In another account, the later campaign view shows lower ACOS and CPC, a higher click-through rate, and $8,612.81 in cumulative attributed sales.
 Listing examples
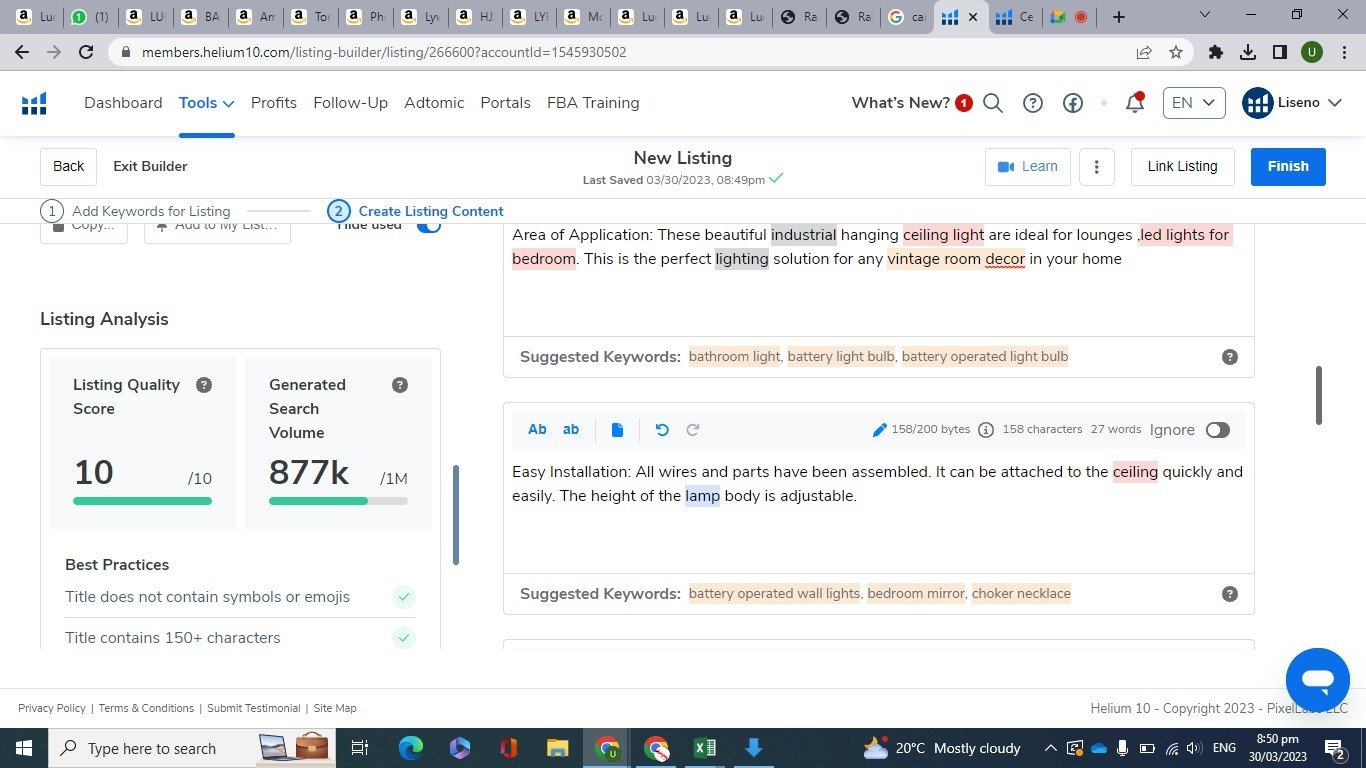
Two listings, one higher content-quality bar
One account’s Helium 10 screenshots show a 6.9/10 quality score for a thank-you card listing and 10/10 for a ceiling-light listing. They are different products.
 Results achieved
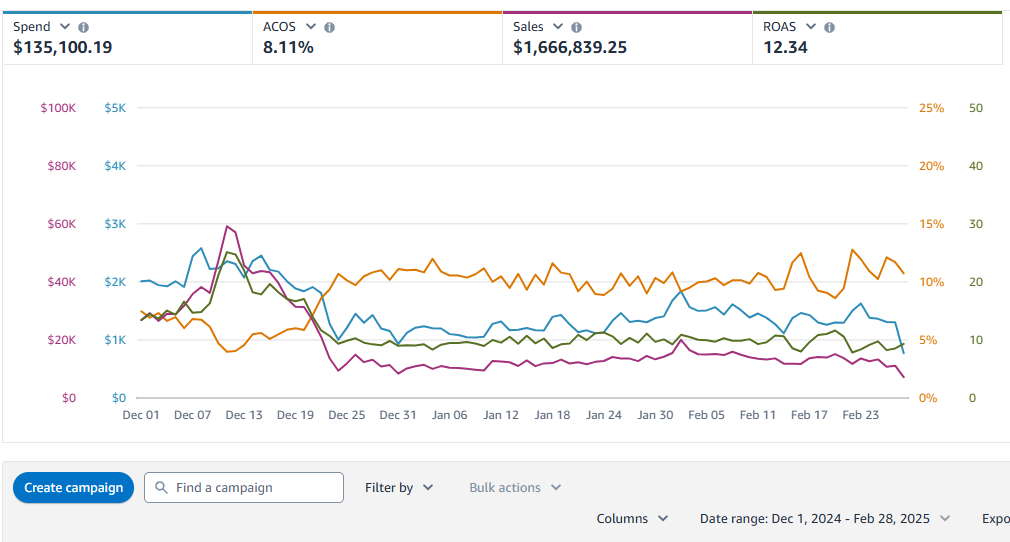
$1.66m in ad sales at 8.11% ACOS
A separate Ads Console account recorded $1,666,839.25 in attributed sales on $135,100.19 of spend over a three-month window.
 Results achieved
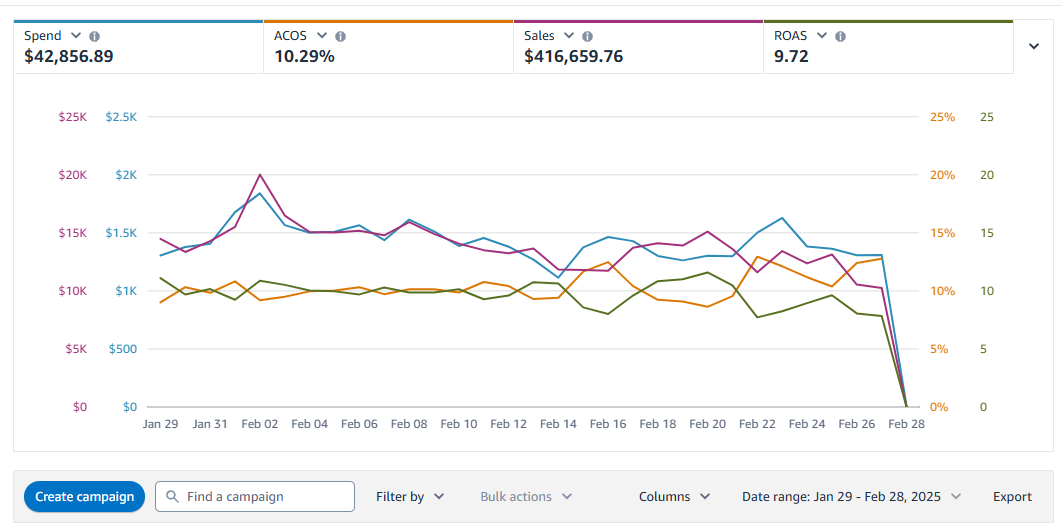
$416.7k in ad sales over 30 days
A different Ads Console account shows $416,659.76 in attributed sales, 10.29% ACOS and 9.72 ROAS in its selected 30-day view.
 Results achieved
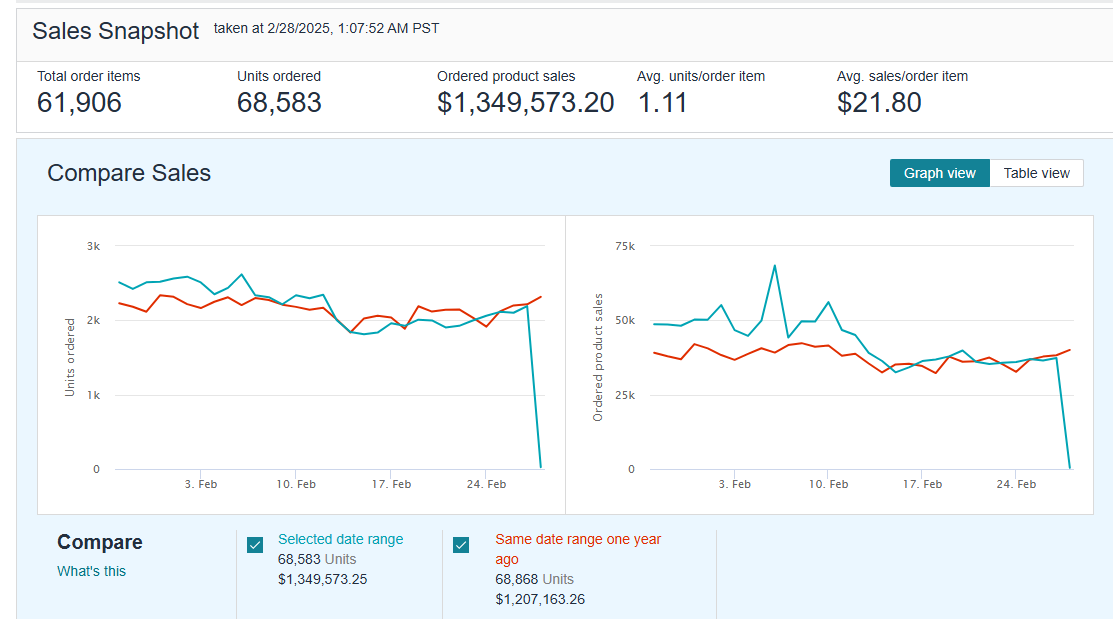
$1.35m in 30-day ordered product sales
A separate Seller Central account shows $1,349,573.20 in ordered product sales and 11.8% more sales value than the same range a year earlier.
 Results achieved
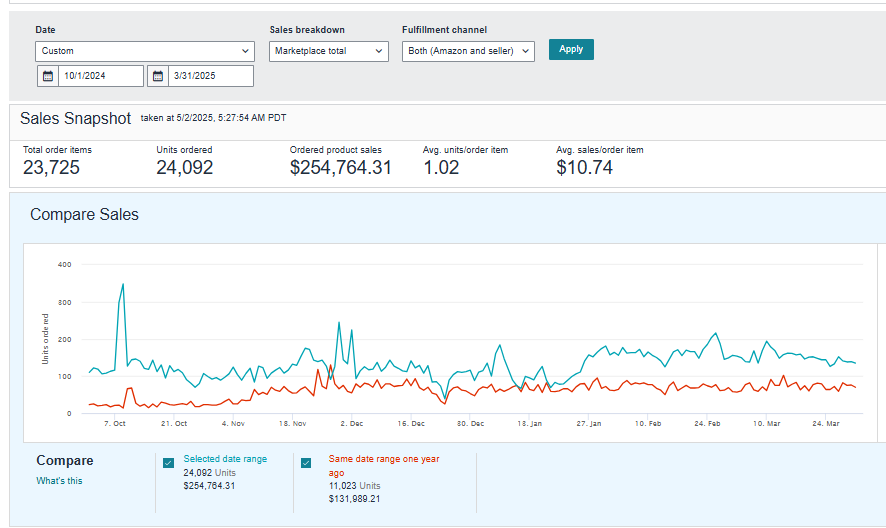
$254.8k versus $132.0k a year earlier
Another Seller Central account shows $254,764.31 in ordered product sales for the selected October-to-March range, compared with $131,989.21 a year earlier.
 Results achieved
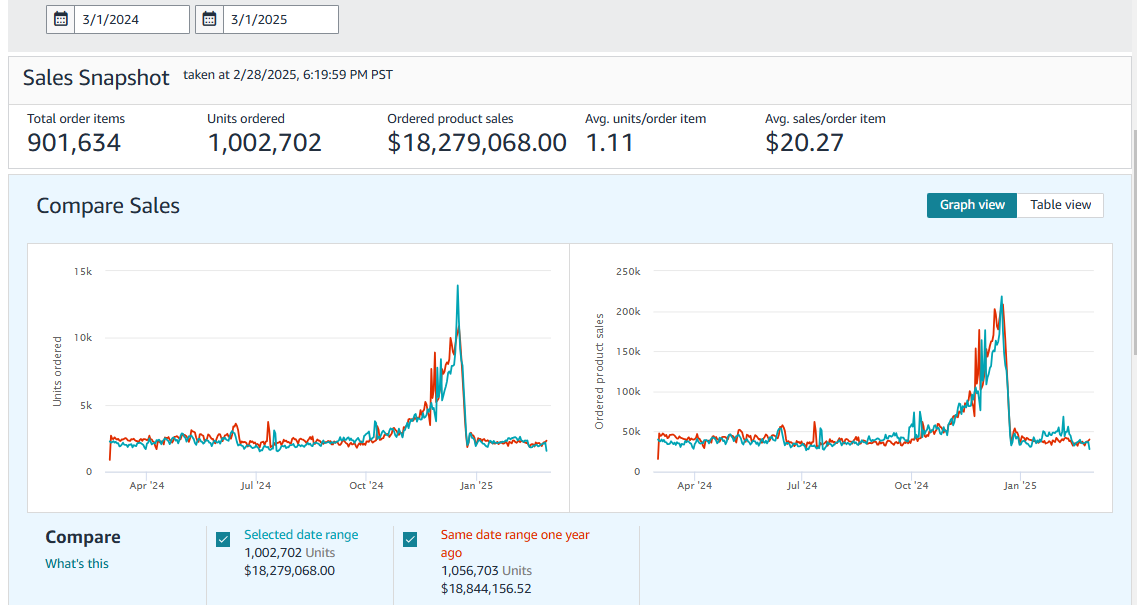
$18.28m in sales—and the honest YoY read
A fifth results account shows $18,279,068 in ordered product sales and more than one million units, while the same-period comparison is 3.0% below the year before.
Go deeper into the PPC comparison
Read an expanded version of the August–September story, with side-by-side screenshots and more context.