
Scale and efficiency in one view
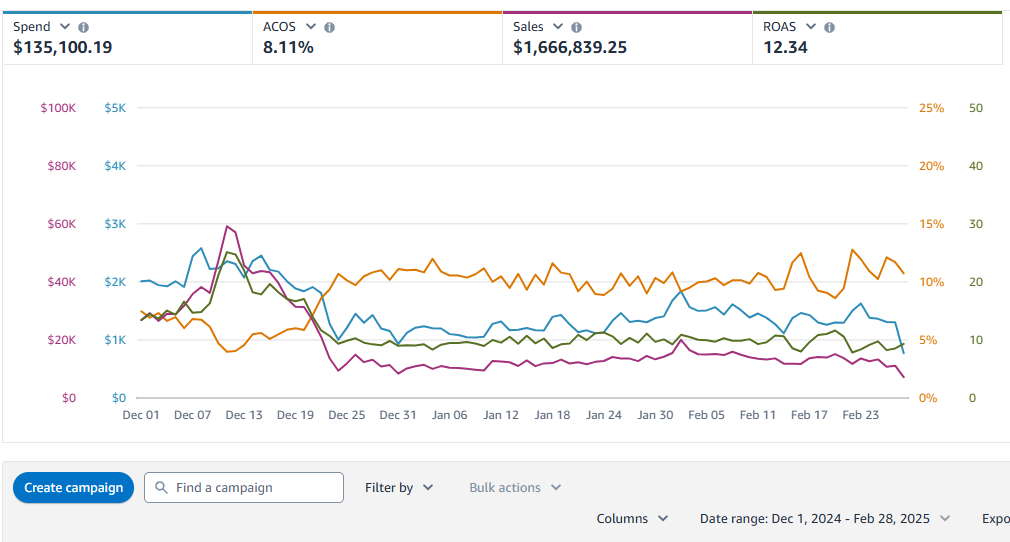
Across December 1 to February 28, the dashboard reports $1,666,839.25 in ad-attributed sales from $135,100.19 of spend. The 8.11% ACOS and 12.34 ROAS describe an efficient reporting period for this account. These are advertising figures—not total Seller Central sales or net profit.
The line chart asks another question
The daily trend contains peaks and quieter stretches. A graph alone cannot tell us whether seasonality, product launches, placements or budgets explain them. What it does show is why an aggregate result should be followed by a product-by-product read before declaring every campaign equally successful.
The source screenshots
The reporting layer
Amazon Ads provides search-term, targeting, advertised-product and placement reports to separate where spend went from where attributed sales arrived. Those deeper reports were not supplied, so this story stays with the verified dashboard totals.
Reading this result responsibly
This three-month screenshot has no earlier equal-length baseline or verified intervention. It establishes strong period performance, not a claimed lift.
Amazon’s official documentation gives context for the metrics and platform rules. It does not establish the cause of this account’s result.